Rightsize Accurately
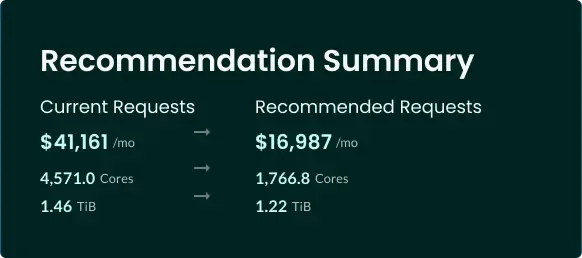
Applications perform reliably and cost effectively — even under fluctuating demand — with infrastructure that is optimally scaled using an advanced workload forecasting machine learning algorithm, which analyzes seasonal trends to recommend optimal resource configurations.
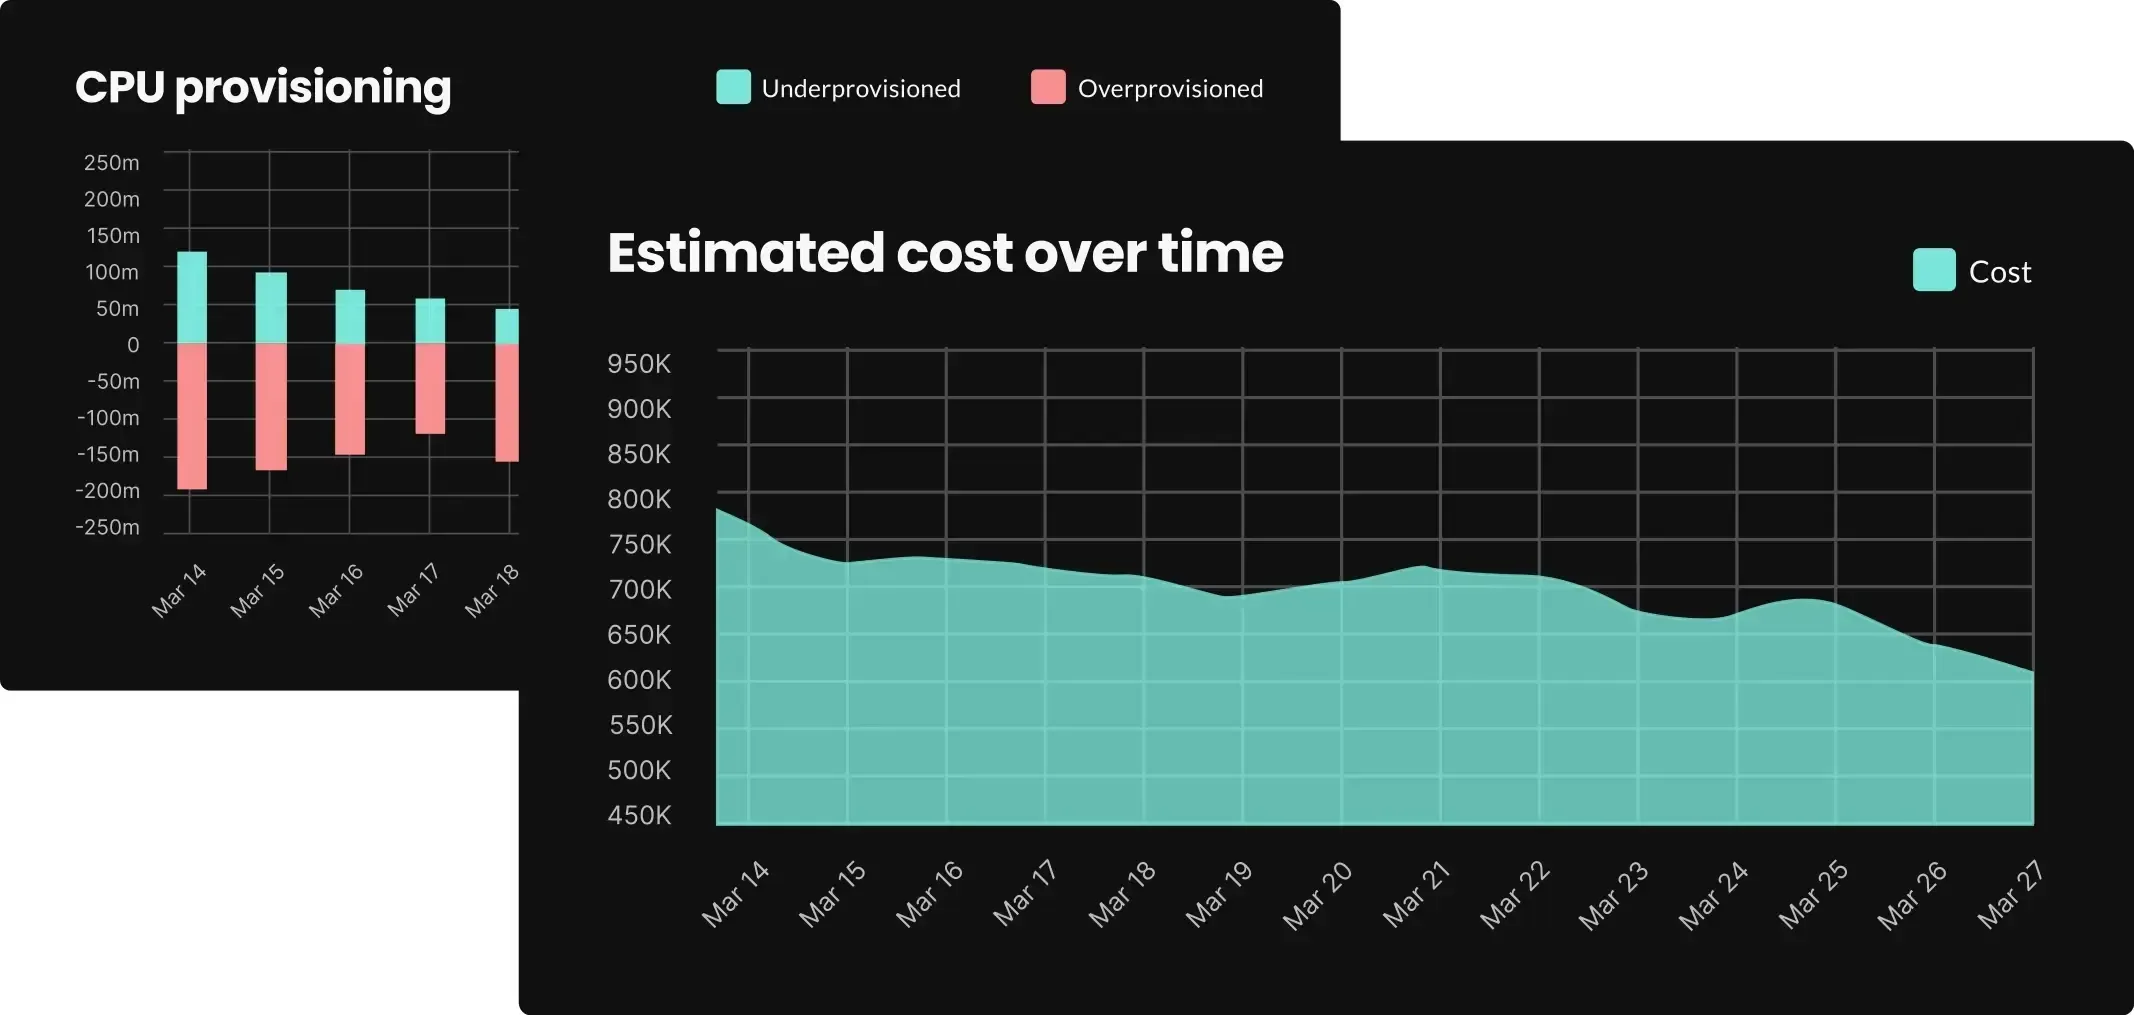
This goes far beyond basic statistical approaches. A fine-grained understanding of each new workload’s demand patterns is built in just a few days with resource utilization analyzed every 15 seconds.